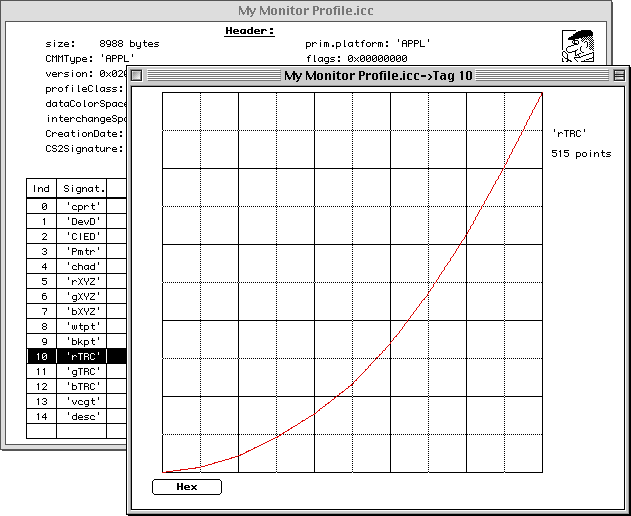
It is occasionally necessary to fit a gamma curve to a set of measurements. Or perhaps you wish to find the best gamma value that represents the data in the red, green or blue TRC tags of an ICC monitor profile:

A common technique is to use a least squares fit of a simple gamma function to the data set:
$$Y = P^\gamma$$In this equation, $Y$ is the measured relative luminance (i.e. in the range [0.0, 1.0]), $P$ is the relative input stimulus (also in the range [0.0, 1.0]), and $\gamma$ is the exponent (i.e. gamma).
This equation is easier to work with if you first take the logarithm of both sides:
$$\log(Y) = \gamma \log(P)$$We can see that it is now a simple linear equation, in terms of $\log(Y)$ and $\log(P)$, passing through the origin and having a slope of $\gamma$. A least squares fit of data set $\{P_i, Y_i\}$ yields the "best" gamma:
$$\gamma = {{\sum\limits_i \log(P_i) \log(Y_i)} \over {\sum\limits_i \log(P_i)^2}}$$Implementation Notes: